
A DRIVE AROUND TOWN
Drive through downtown Jersey City
A recorded drive through downtown Jersey City, including the waterfront and neighborhood streets. This is not a live camera.
Watch on YouTube ↗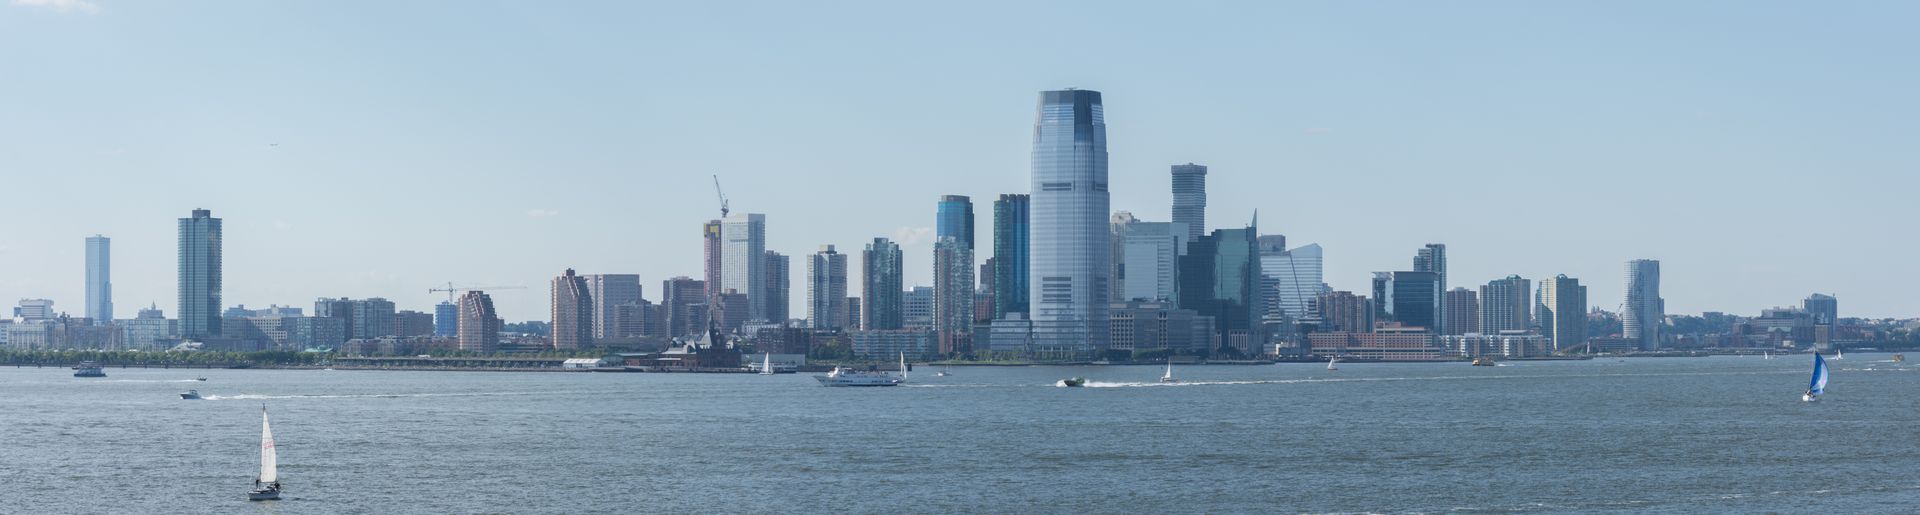
Weather · October
Average highs of 65°F, lows of 51°F and 4.4 in of rain, from 30 years of weather records.
October is Jersey City’s 6th warmest month, with average highs of 65°F and lows of 51°F. That is 12° cooler than September, and 2° above the yearly average high.
High and low Rain
See all upcoming events and school days off.


A look around town before you go.
A DRIVE AROUND TOWN
A recorded drive through downtown Jersey City, including the waterfront and neighborhood streets. This is not a live camera.
Watch on YouTube ↗
THINGS TO DO · YOUTUBE SHORT
An activity Short shared by Strides & Scenes.
Watch on YouTube ↗Planning a trip? See the best time to visit Jersey City and today’s forecast.
Average highs are 65°F and average lows 51°F, for a daily mean of 58°F. Individual days run hotter or colder than these 30-year averages.
October averages 4.4 in of precipitation over about 10 days with at least 0.01 in. It is the 4th wettest month of the year.
Around mid-October the sun rises about 7:06 AM and sets about 6:17 PM, for roughly 11.2 hours of daylight.
The mildest months for visiting are May, June, September. October is mild, with Halloween events.
NOAA U.S. Climate Normals 1991–2020, New York Cntrl Pk Twr station (5.7 mi from downtown). Sunrise and sunset are calculated for October 15 at the city’s coordinates.